Related Articles


What is k-nearest Neighbors Algorithm?
In this article, we will delve into the k-nearest Neighbors Algorithm, or KNN. KNN is a supervised machine learning algorithm employed for both classification and regression tasks. It operates on a straightforward and intuitive principle—the principle of proximity. The underlying concept is that similar things tend to be in close proximity to each other. In KNN, ‘k’ parameter denotes the number of nearest neighbors you choose to consider. It functions as a lazy classification algorithm, lacking a discriminative function derived from the training data. Instead, KNN memorizes the training data, skipping a dedicated learning phase for the model. All the computational work takes place at the time of a prediction request.
KNN with a simple example
Let’s examine this example. Suppose we have the given blue and red points, and our goal is to classify the yellow point. The process involves determining the distance between this yellow point and others in different classes, followed by sorting them in ascending order.
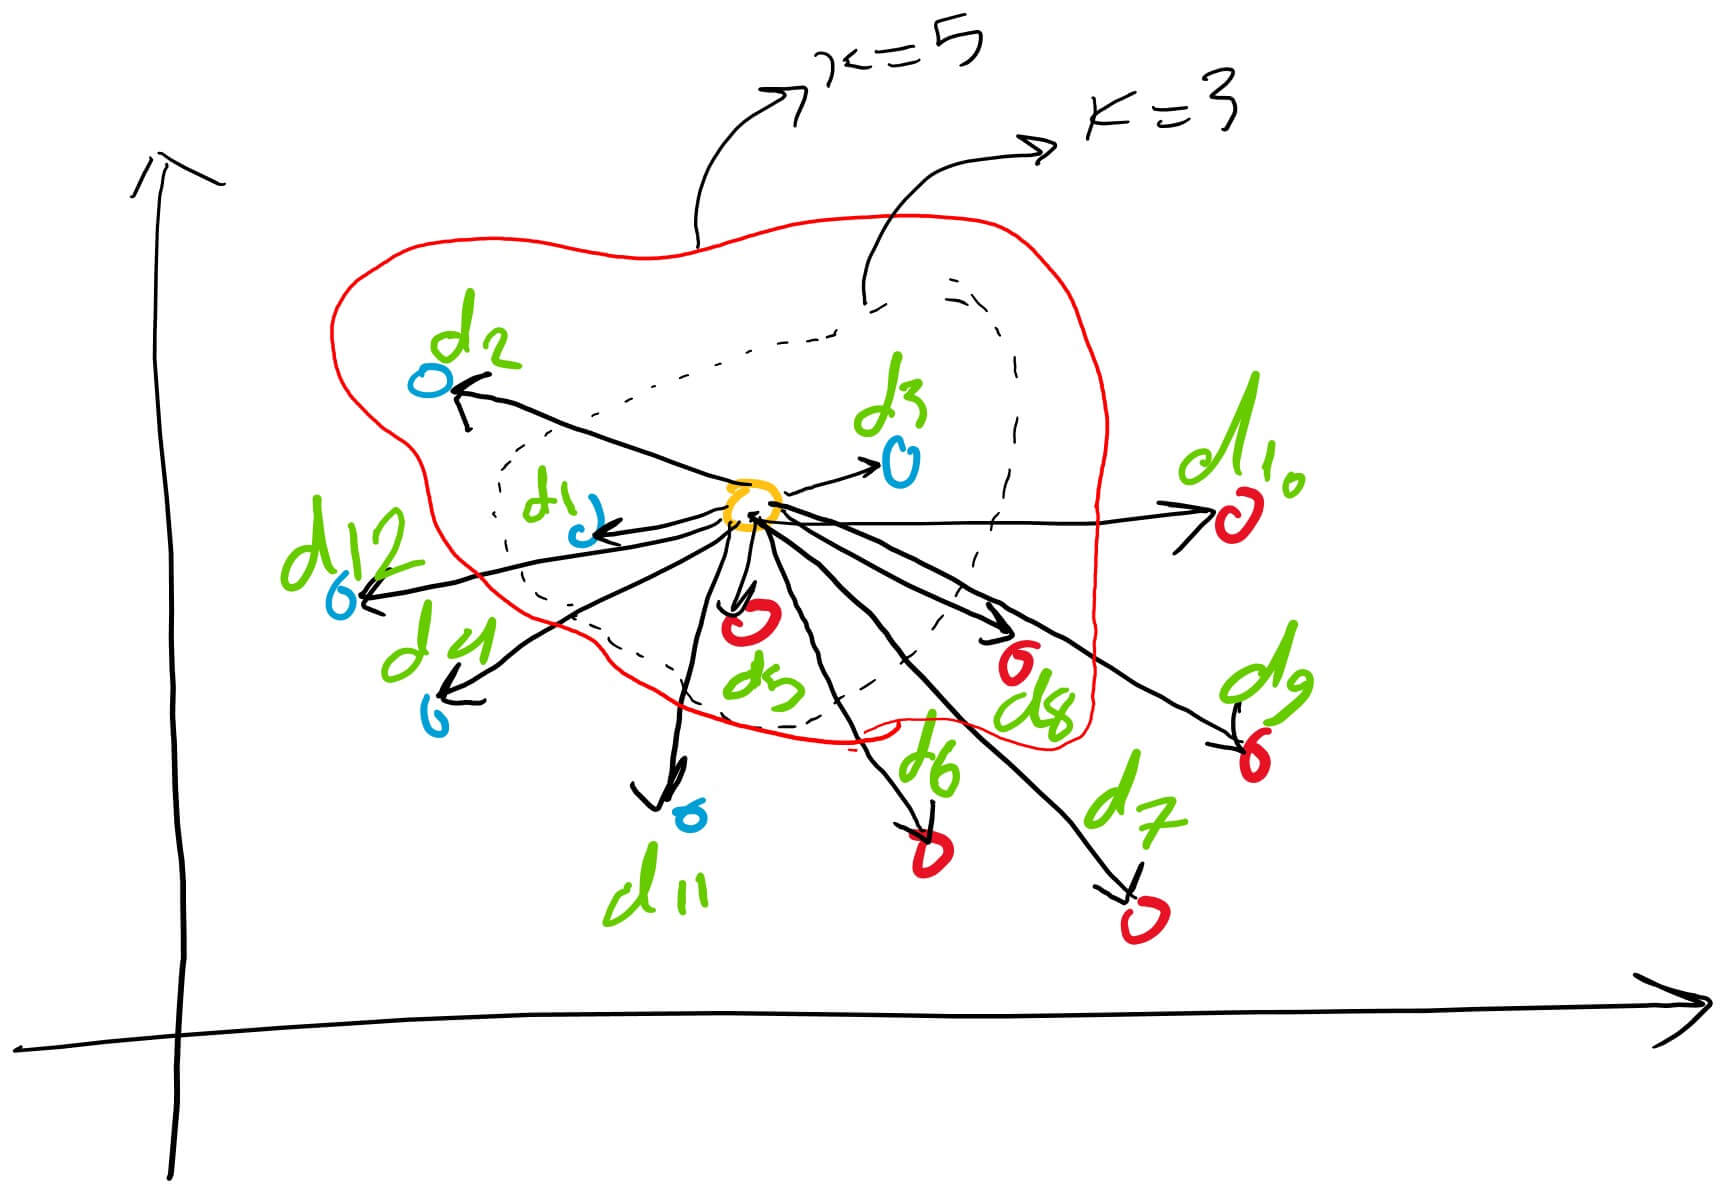
Assuming ‘k’ is set to three, we focus on the first three shortest distances—d5, d1, and d3. This region represents our nearest proximity or nearest neighbors. Given that the majority of votes or points are blue, we classify the yellow point as a blue point or make the decision that it belongs to the class of blue points.
How to find distance in the k-nearest Neighbours algorithm?
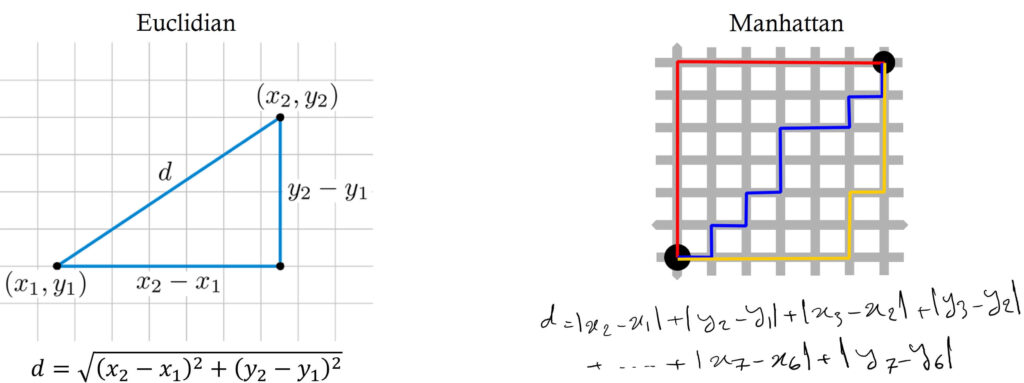
Distances are computed using various metrics, with Euclidean distance being the most commonly employed. The formula for Euclidean distance between two points is presented here, along with the Manhattan distance for the same two points. Manhattan distance is the sum of absolute differences of adjacent points.
K-nearest Neighbours algorithm with example 2
Let’s explore another example involving seven students divided into groups A and B. Our goal is to determine the class for a student with a height of 160 cm and a weight of 50 kg. The process involves calculating the distance from this point to every individual point in the dataset.
| Height (cms) | Weight (kgs) | Group | Distance |
| 163 | 45 | A | 5.830 |
| 153 | 56 | A | 9.219 |
| 134 | 56 | B | 26.683 |
| 142 | 47 | A | 18.248 |
| 158 | 56 | B | 6.324 |
| 165 | 45 | B | 7.071 |
| 183 | 80 | A | 37.802 |
We find the differences between 160 and 163 for height and 50 and 45 for weight. Subsequently, we square these differences, sum them up, and take the square root of the final result for the first row. This process is repeated for the other rows, and the distances are sorted in ascending order. Assuming ‘k’ is set to three, we observe that the majority of votes favor class B for this student. Consequently, we classify this student as belonging to group B.
Analyzing the values of k
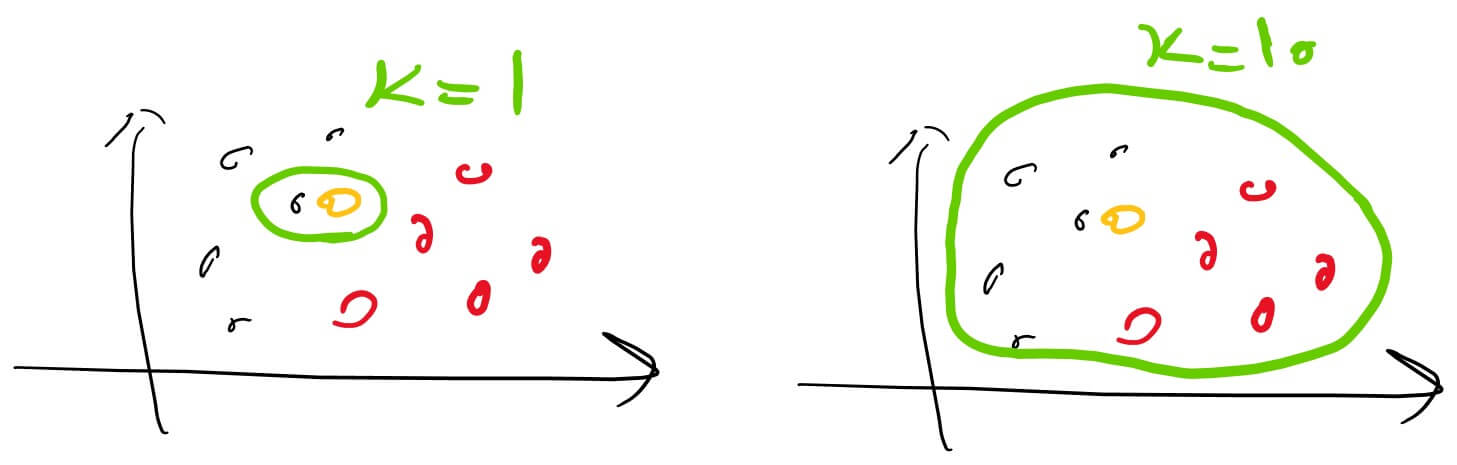
a small ‘k’ leads to low bias, high variance, and overfitting, while a large ‘k’ results in high bias, low variance, and underfitting. Therefore, ‘k’ plays a crucial role in balancing between overfitting and underfitting.
How to use KNN algorithm for regression problems?
It’s important to note that for regression problems, where we’re predicting a continuous value, the approach differs. Instead of finding the majority of votes, we take the average of the ‘k’ nearest neighbor labels.
